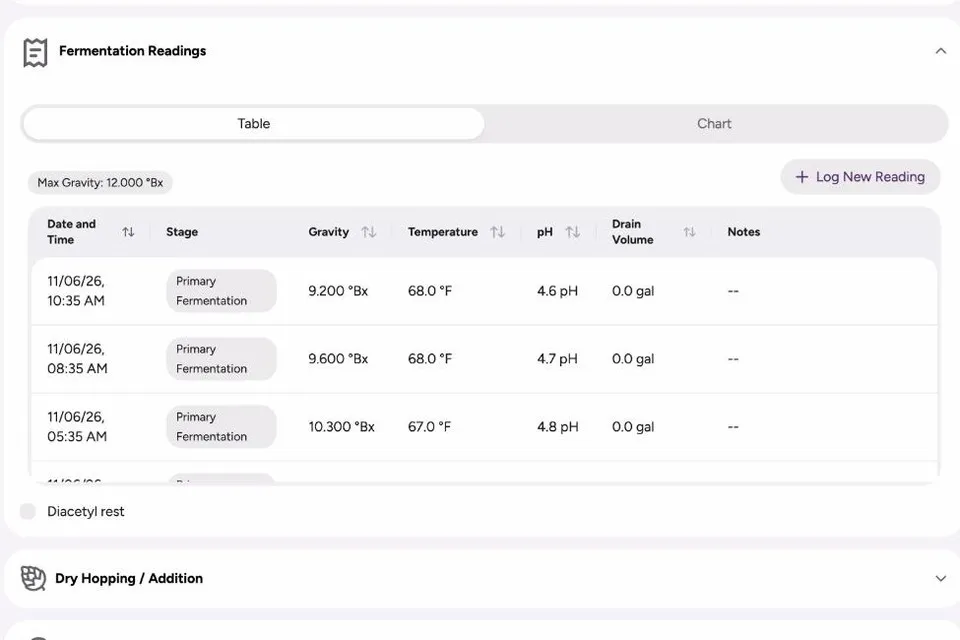
Fermentation is where most of a beer’s character is decided, and most of it happens out of sight. A few gravity and temperature readings a day are enough to know whether the yeast is working, whether the temperature is drifting, and when the beer is ready to move on. Fermentation Tracking keeps those readings together and draws them on a chart, so trends are obvious at a glance.
Who Fermentation Tracking is for
It is for homebrewers who check gravity with a hydrometer or refractometer and want a cleaner log than a notebook, and for nano and small breweries that need a fermentation record for every tank and batch. It works the same for beer, cider and mead.
How to track a fermentation in Foambyte
- Start the stage. When brew day ends, the batch moves to primary fermentation with its original gravity, transfer temperature and volume already recorded.
- Record the pitch. Log the yeast you actually pitched, so the batch reflects what went into the fermenter.
- Log readings. Add gravity, temperature, pH and drained volume whenever you take a sample. Each reading gets a date and time.
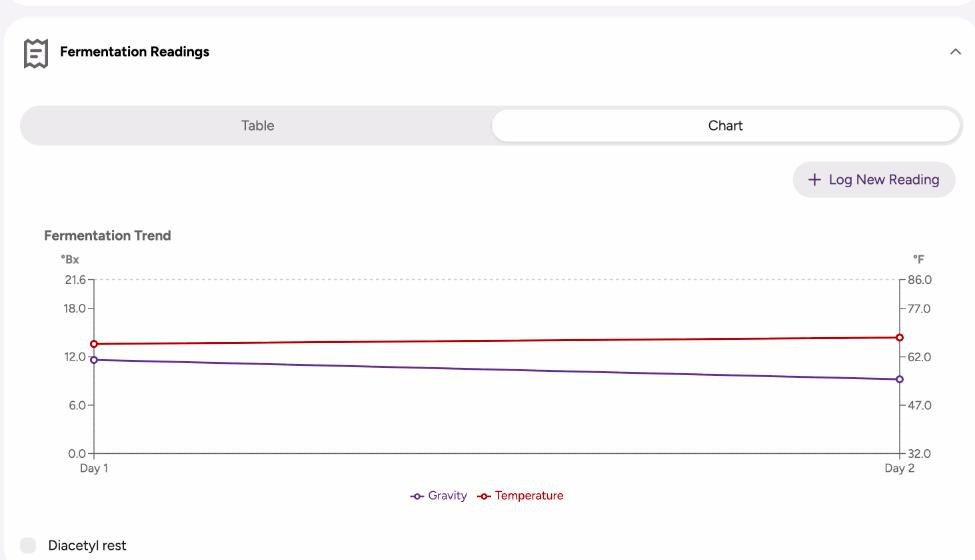
- Watch the chart. Switch between the readings table and the chart to see gravity fall and temperature move.
- Move on when it’s done. The latest gravity becomes the final gravity; record the transfer temperature and volume and continue to conditioning, where you can keep logging.
What you can do with Fermentation Tracking
- Keep a complete fermentation log. Gravity, temperature, pH, drained volume and notes, with a date and time for every reading.
- See trends on a chart. Gravity and temperature are plotted together, each on its own scale, and the chart can show all readings or the last reading per day, week or month.
- Compare with your targets. Fermentation vitals put the recipe’s targets next to the batch’s latest values.
- Follow the schedule. Each stage shows its planned dates and the current day, such as “Day 2 of 8”.
- Record additions. Log dry hops and other additions during fermentation and conditioning, and mark a diacetyl rest.
- Use your own units. Gravity in SG, °Plato or °Brix, temperature in °C or °F.
A worked example: the first day of an Irish Red Ale
An Irish Red Ale went into the fermenter at 12.0 °Brix (about 1.048) and 65 °F. Readings every three hours show the classic start of an ale fermentation: almost no change for the first six hours while the yeast gets going, then the gravity falls steadily to 9.2 °Brix by the next morning while the temperature climbs to 68 °F from the heat of fermentation.
Those 9.2 °Brix are not the real gravity, though: alcohol makes a refractometer read high. Correcting for alcohol with the refractometer calculator gives the true gravity, and the ABV calculator shows how much alcohol the beer has so far. Hydrometer readings taken at a warm temperature can be corrected with the hydrometer temperature correction.
Fermentation Tracking and the rest of Foambyte
Fermentation is one stage of Batch Tracking, so the readings sit alongside the brew day, conditioning and carbonation records of the same batch. The schedule comes from the brew cycle in your brewing profiles, and when IoT integration arrives, readings from Tilt hydrometers will land on the same chart automatically.
Log your next fermentation for free and see it on a chart.